Turbocharger Vane Wear Analysis Using Statistical Image Processing
Objective
Develop a cost-effective, automated system for quantitative analysis of turbocharger vane wear using statistical image processing techniques ### Technology Stack
The solution utilizes entirely open-source technologies:
- ImageMagick - Command-line image processing and analysis imagemagick.org
- R Statistical Computing - Statistical analysis and data visualization r-project.org
- Arduino - Hardware control for camera positioning and indexing arduino.cc
Test Protocol
- Sample Positioning: Nozzle vane modules are mounted on a precision indexing table
- Camera Alignment: Optical system positioned perpendicular to vane leading edge
- Automated Capture: Indexing system rotates to capture all 14 vanes sequentially
- Data Processing: R scripts execute ImageMagick routines for edge detection and statistical analysis
Experimental Setup
Hardware Configuration
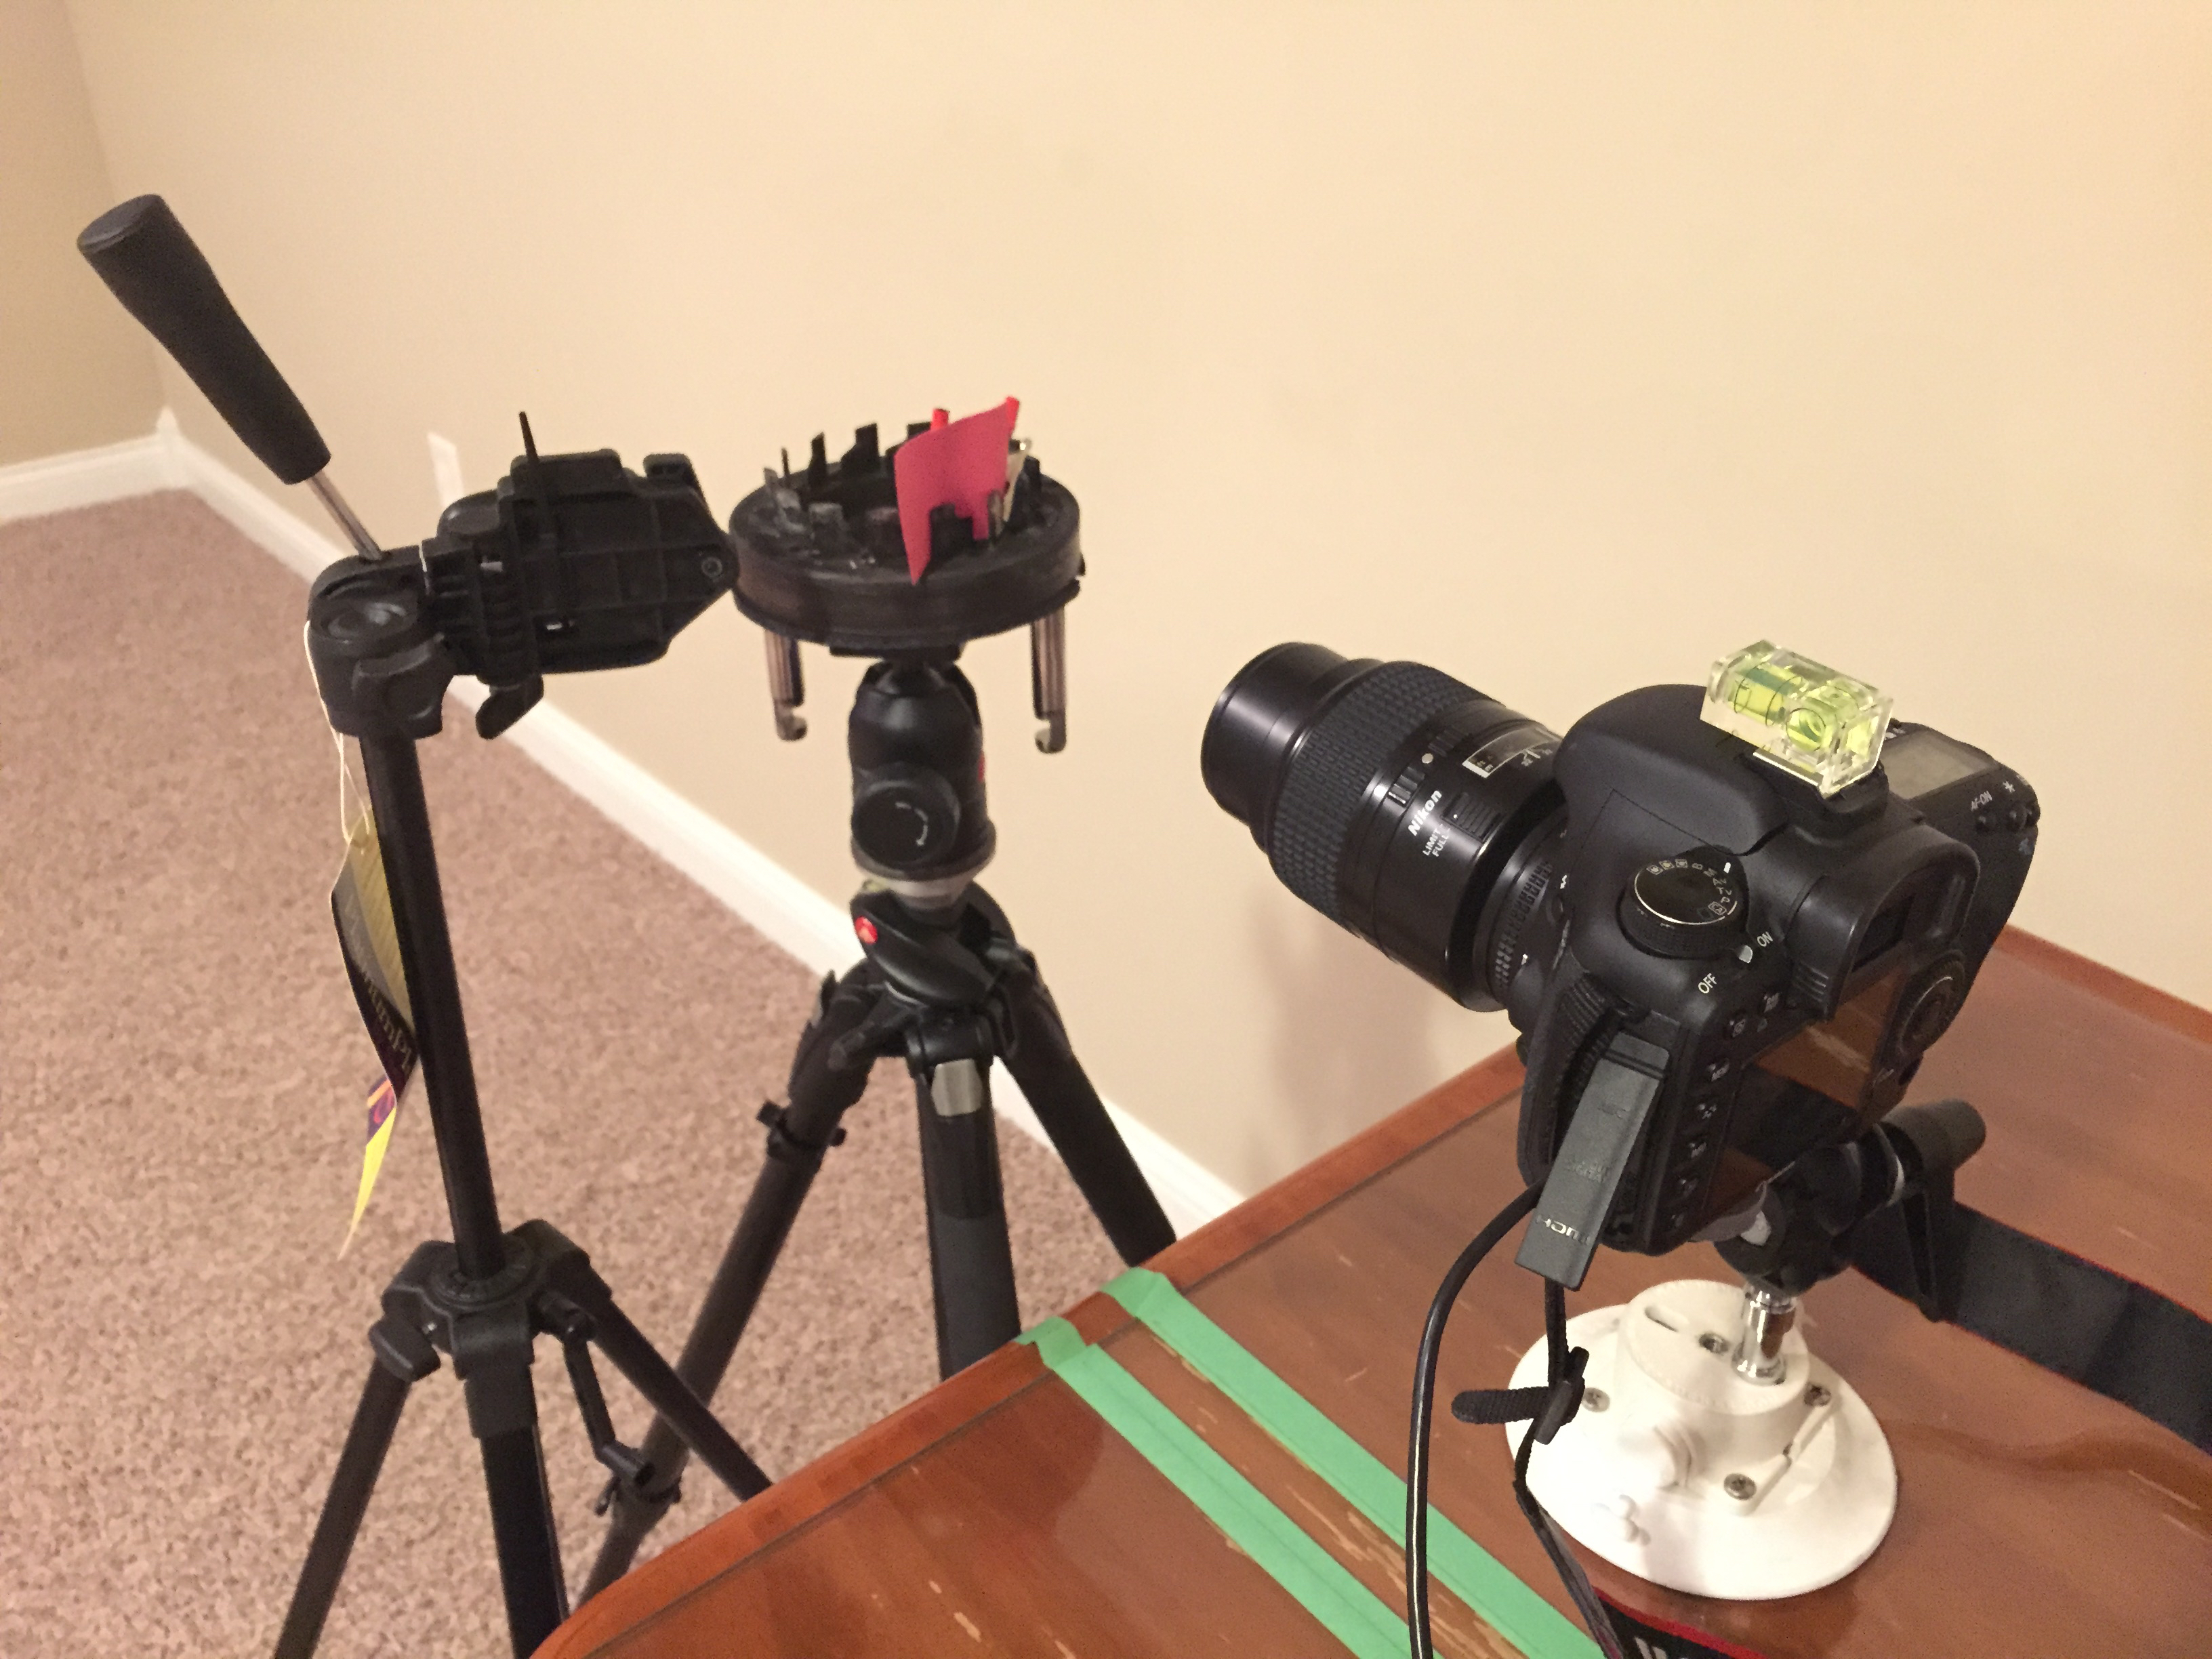
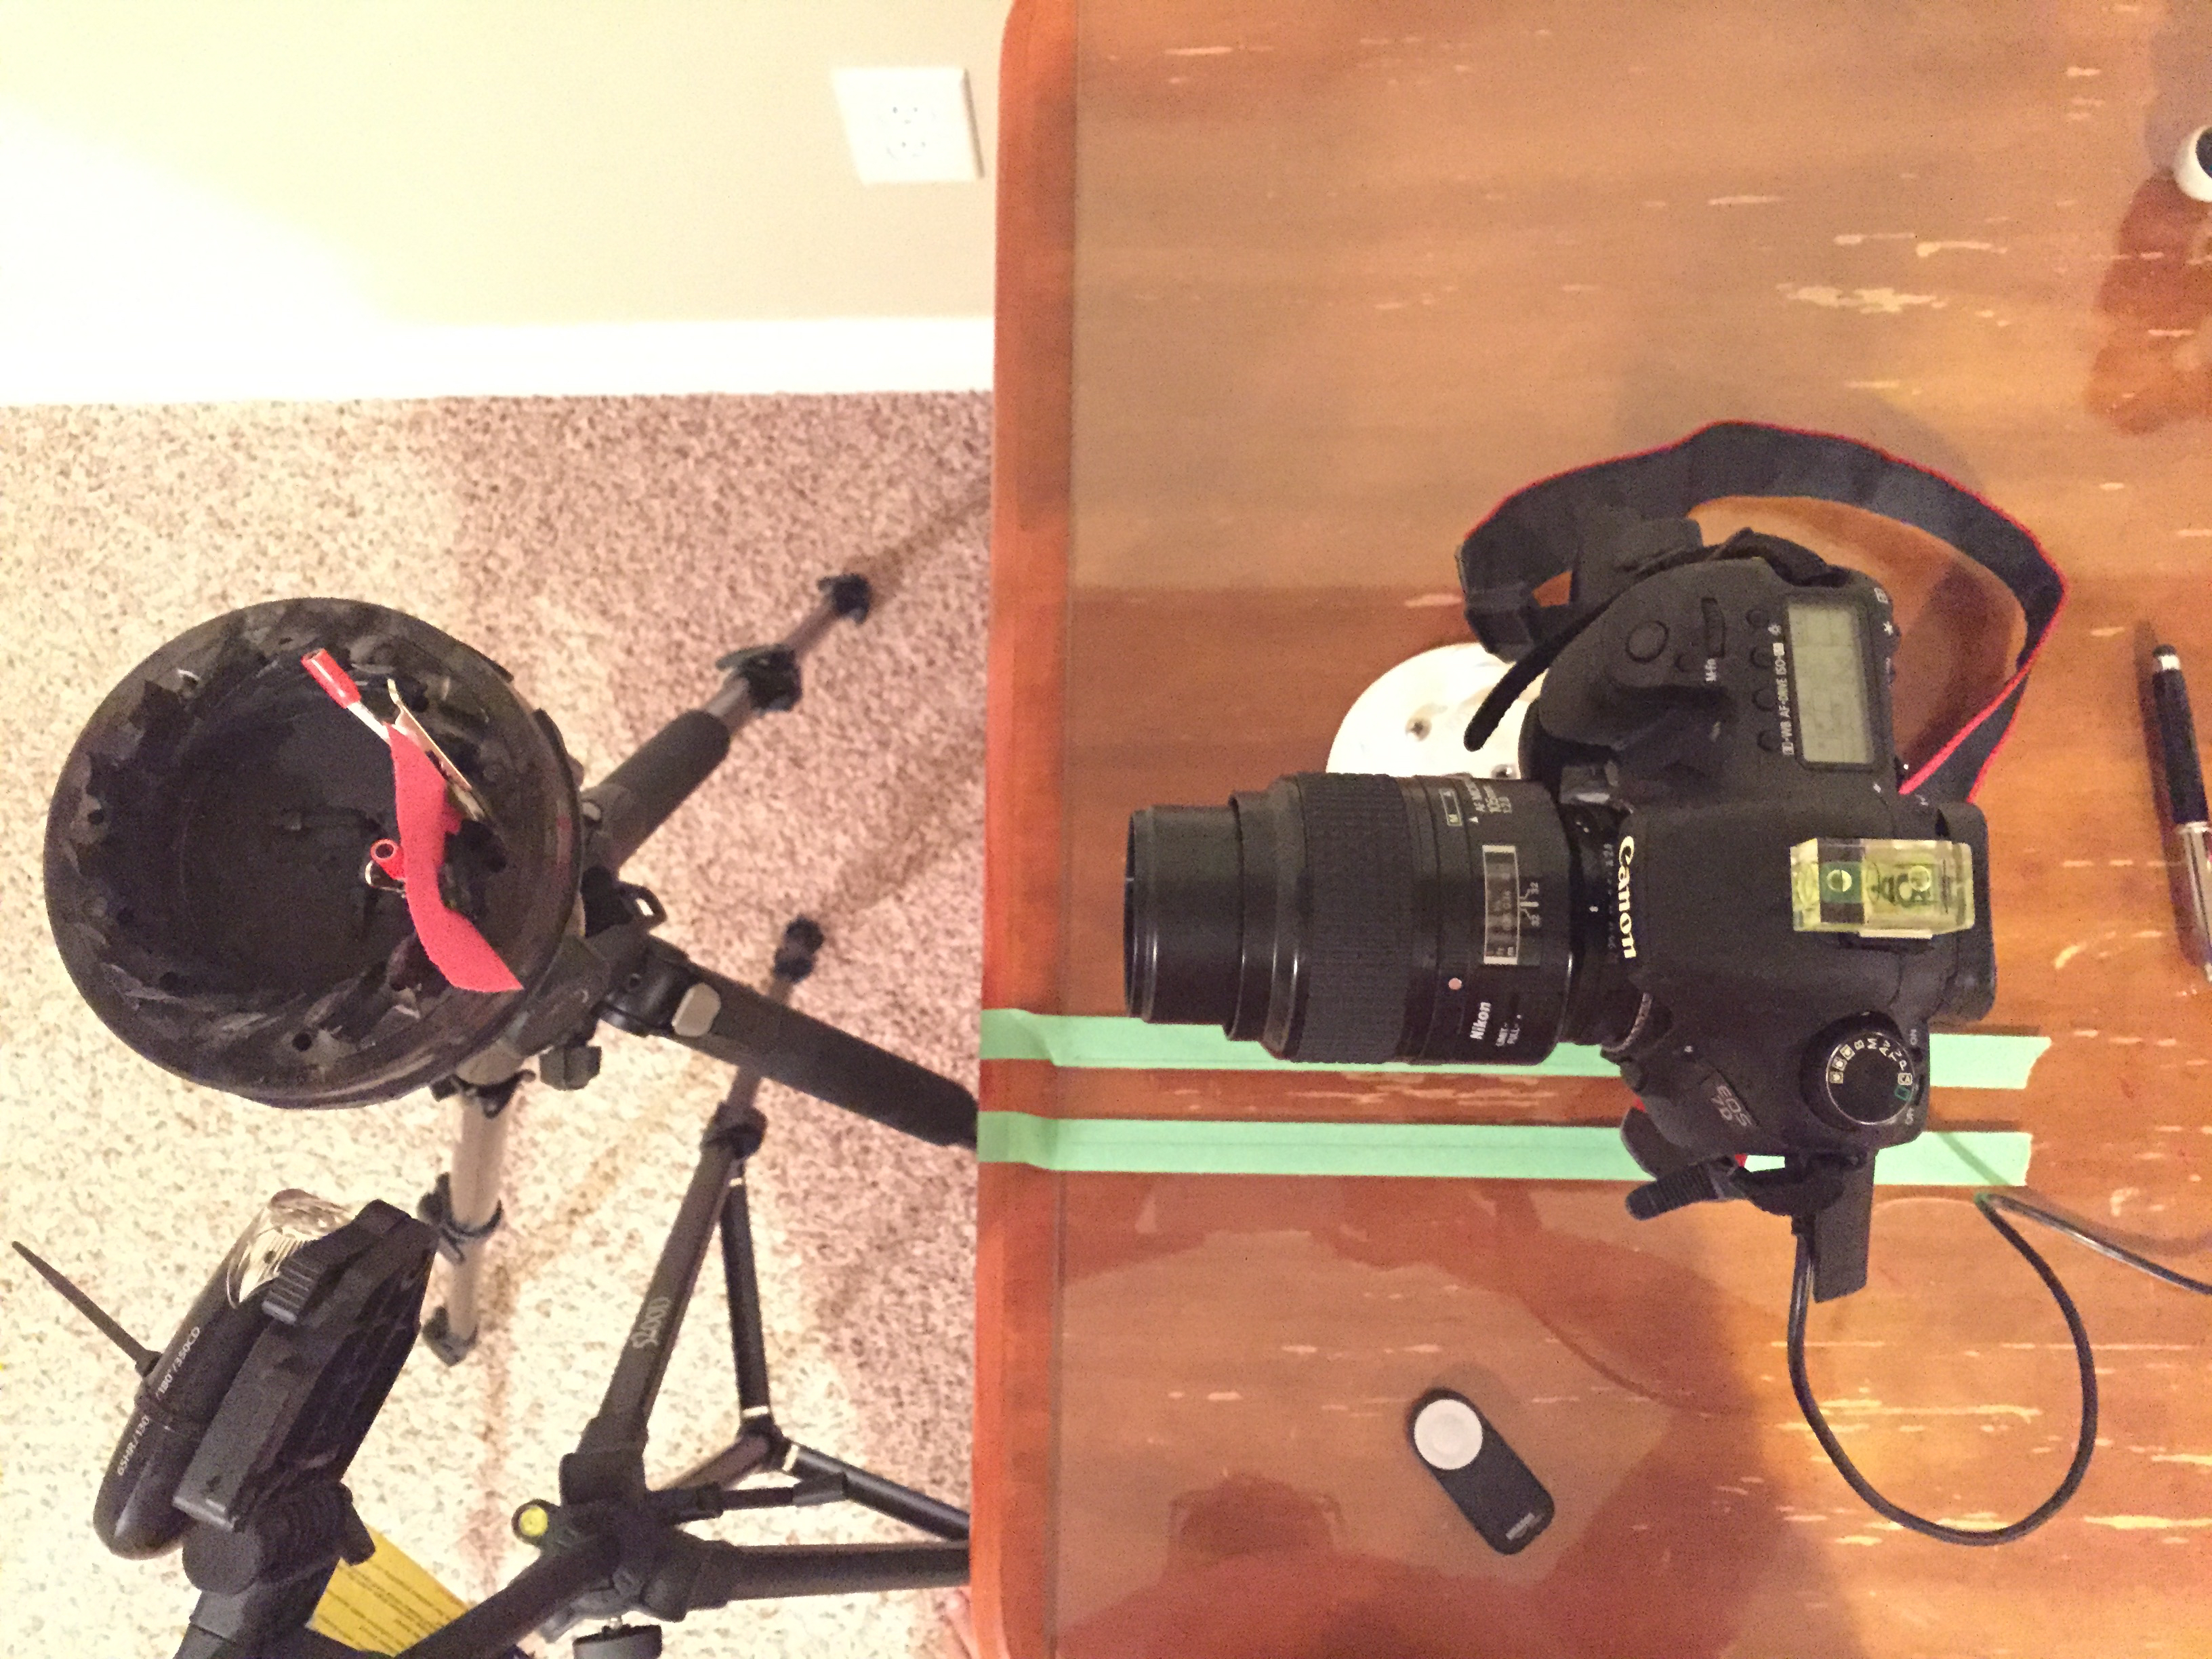
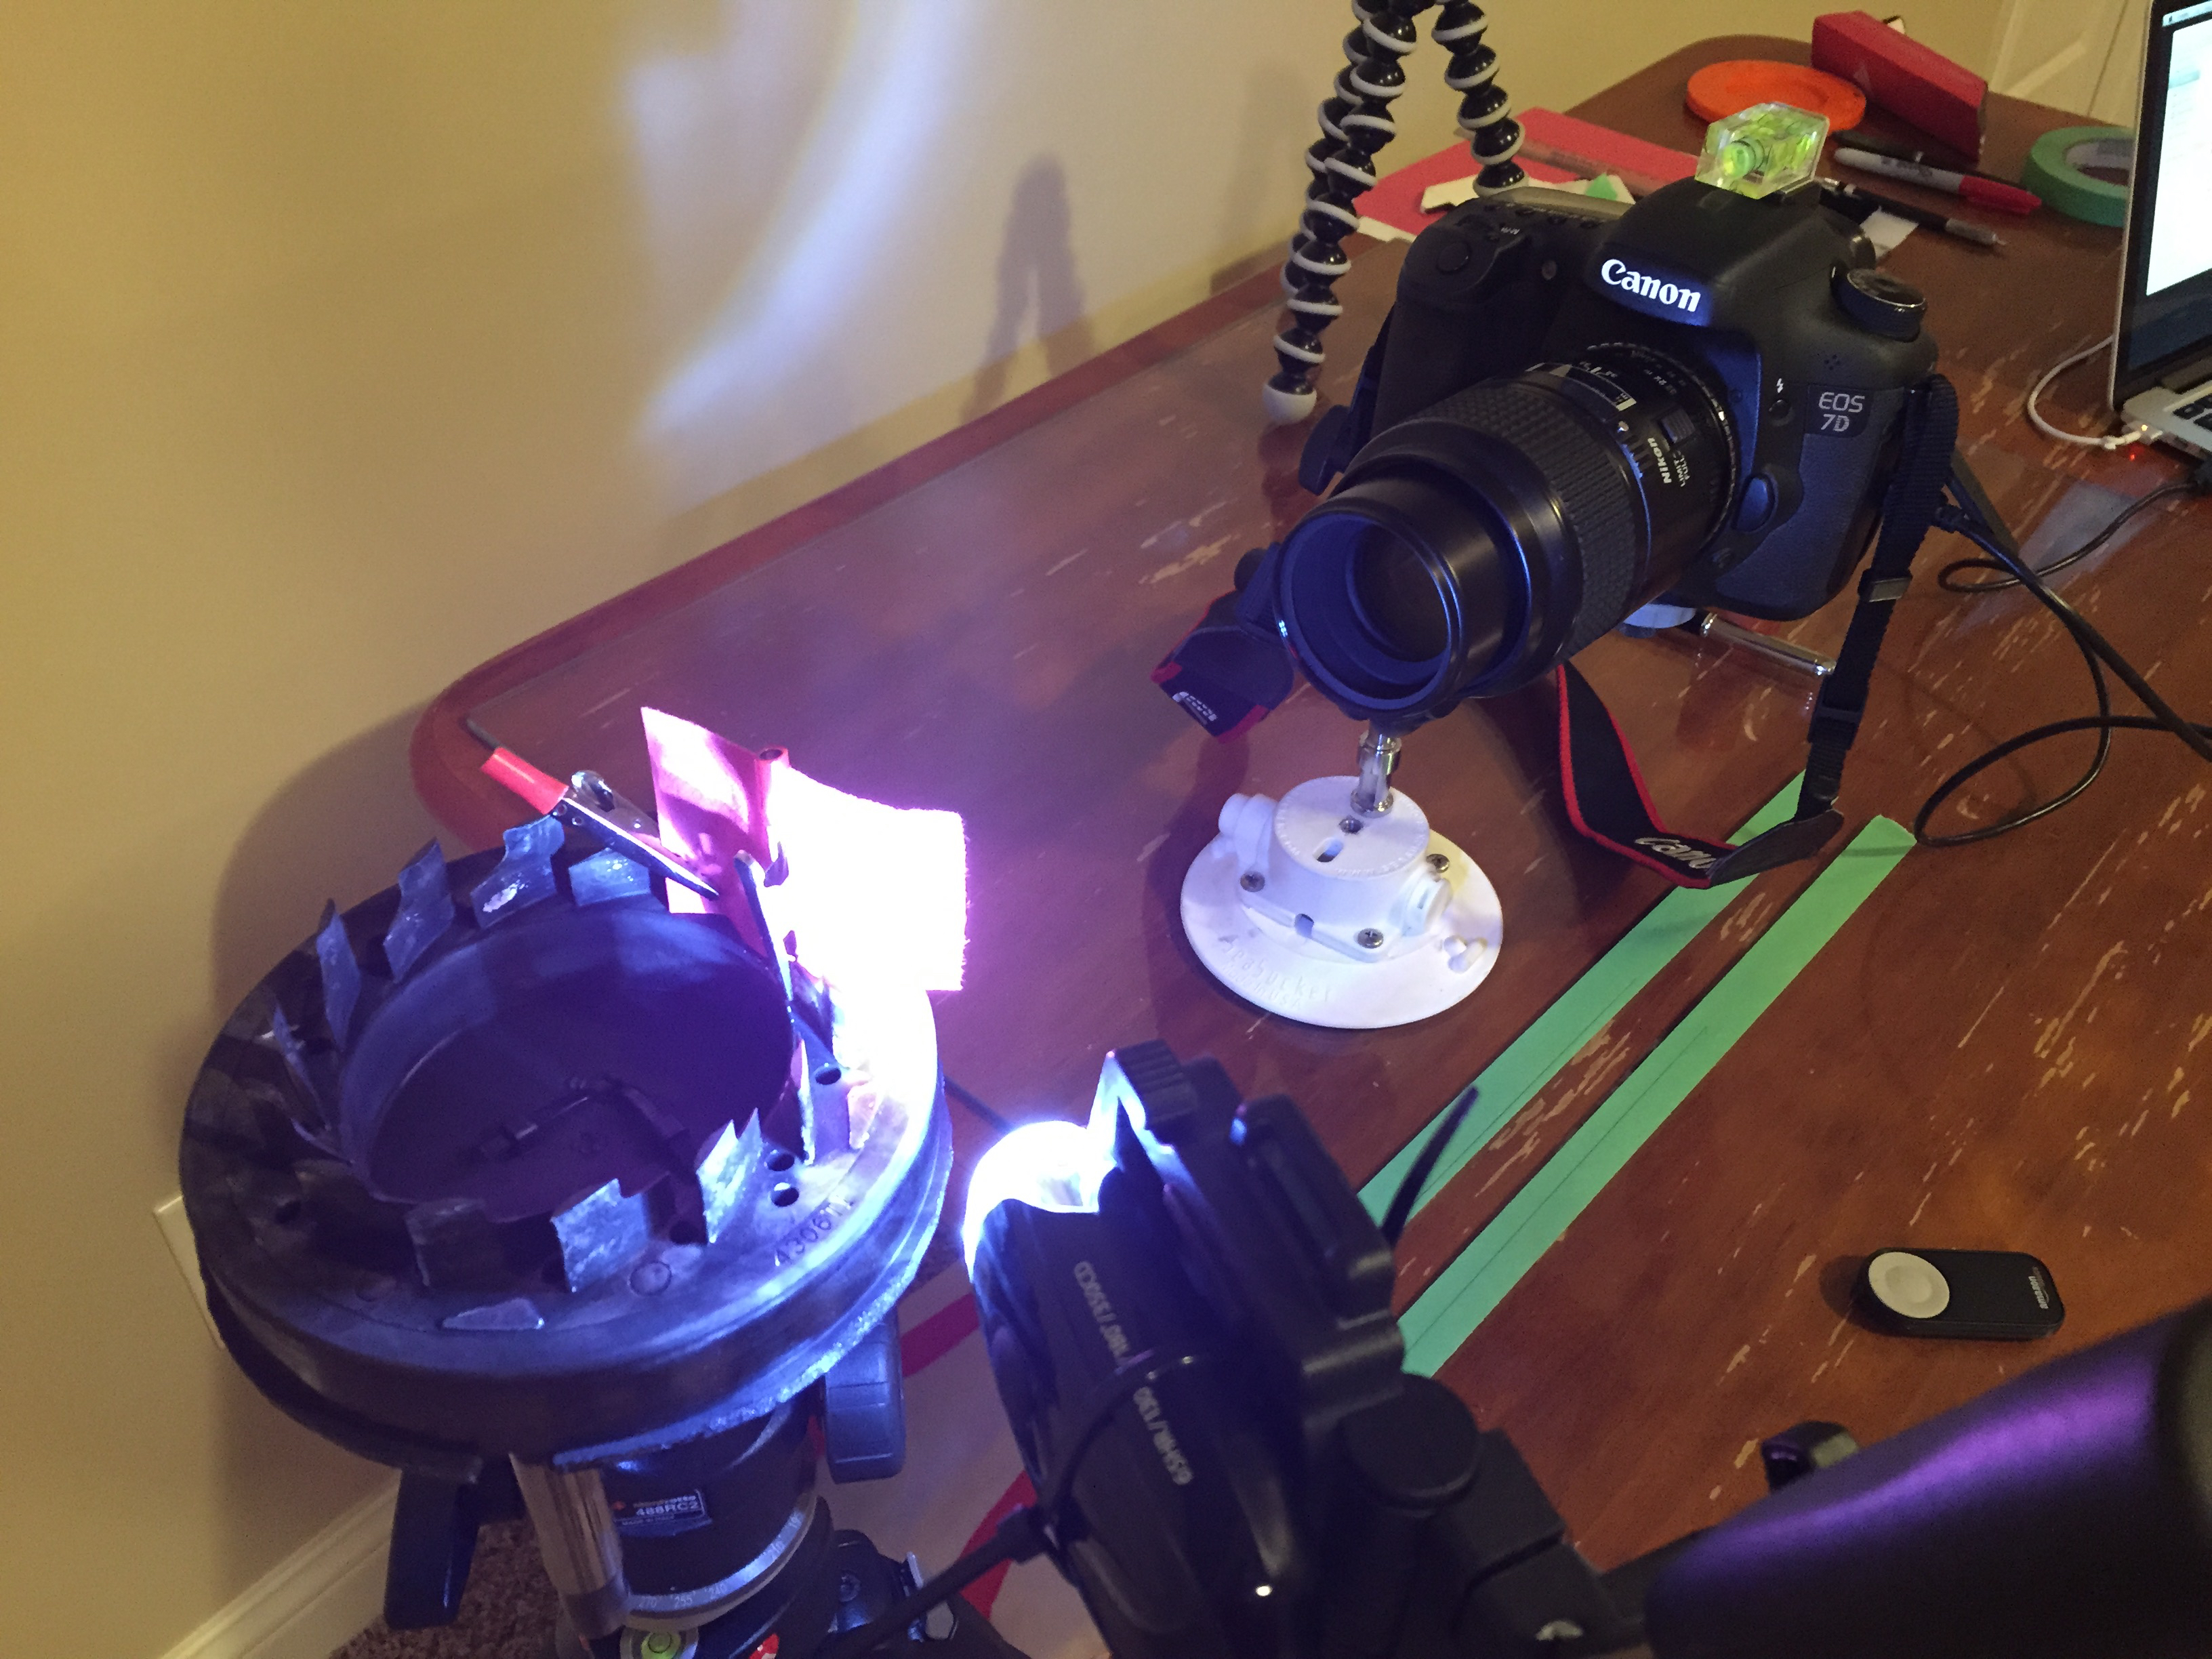
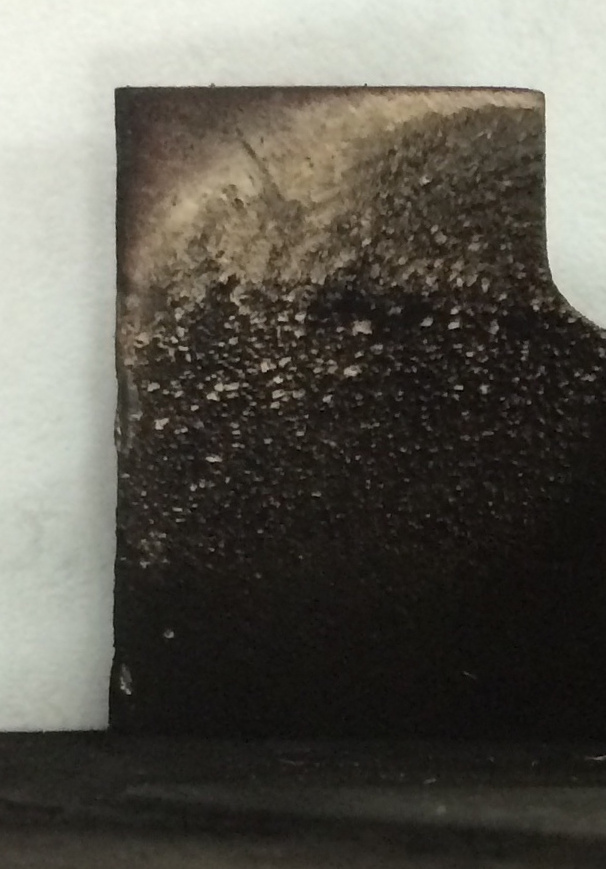
Key Components: - Precision indexing platform with tripod-mounted head for repeatable positioning - Canon 7D DSLR with 105mm Nikkor Macro lens (manual focus and exposure) - Dual lighting configuration: incident window light and backlight with red filter
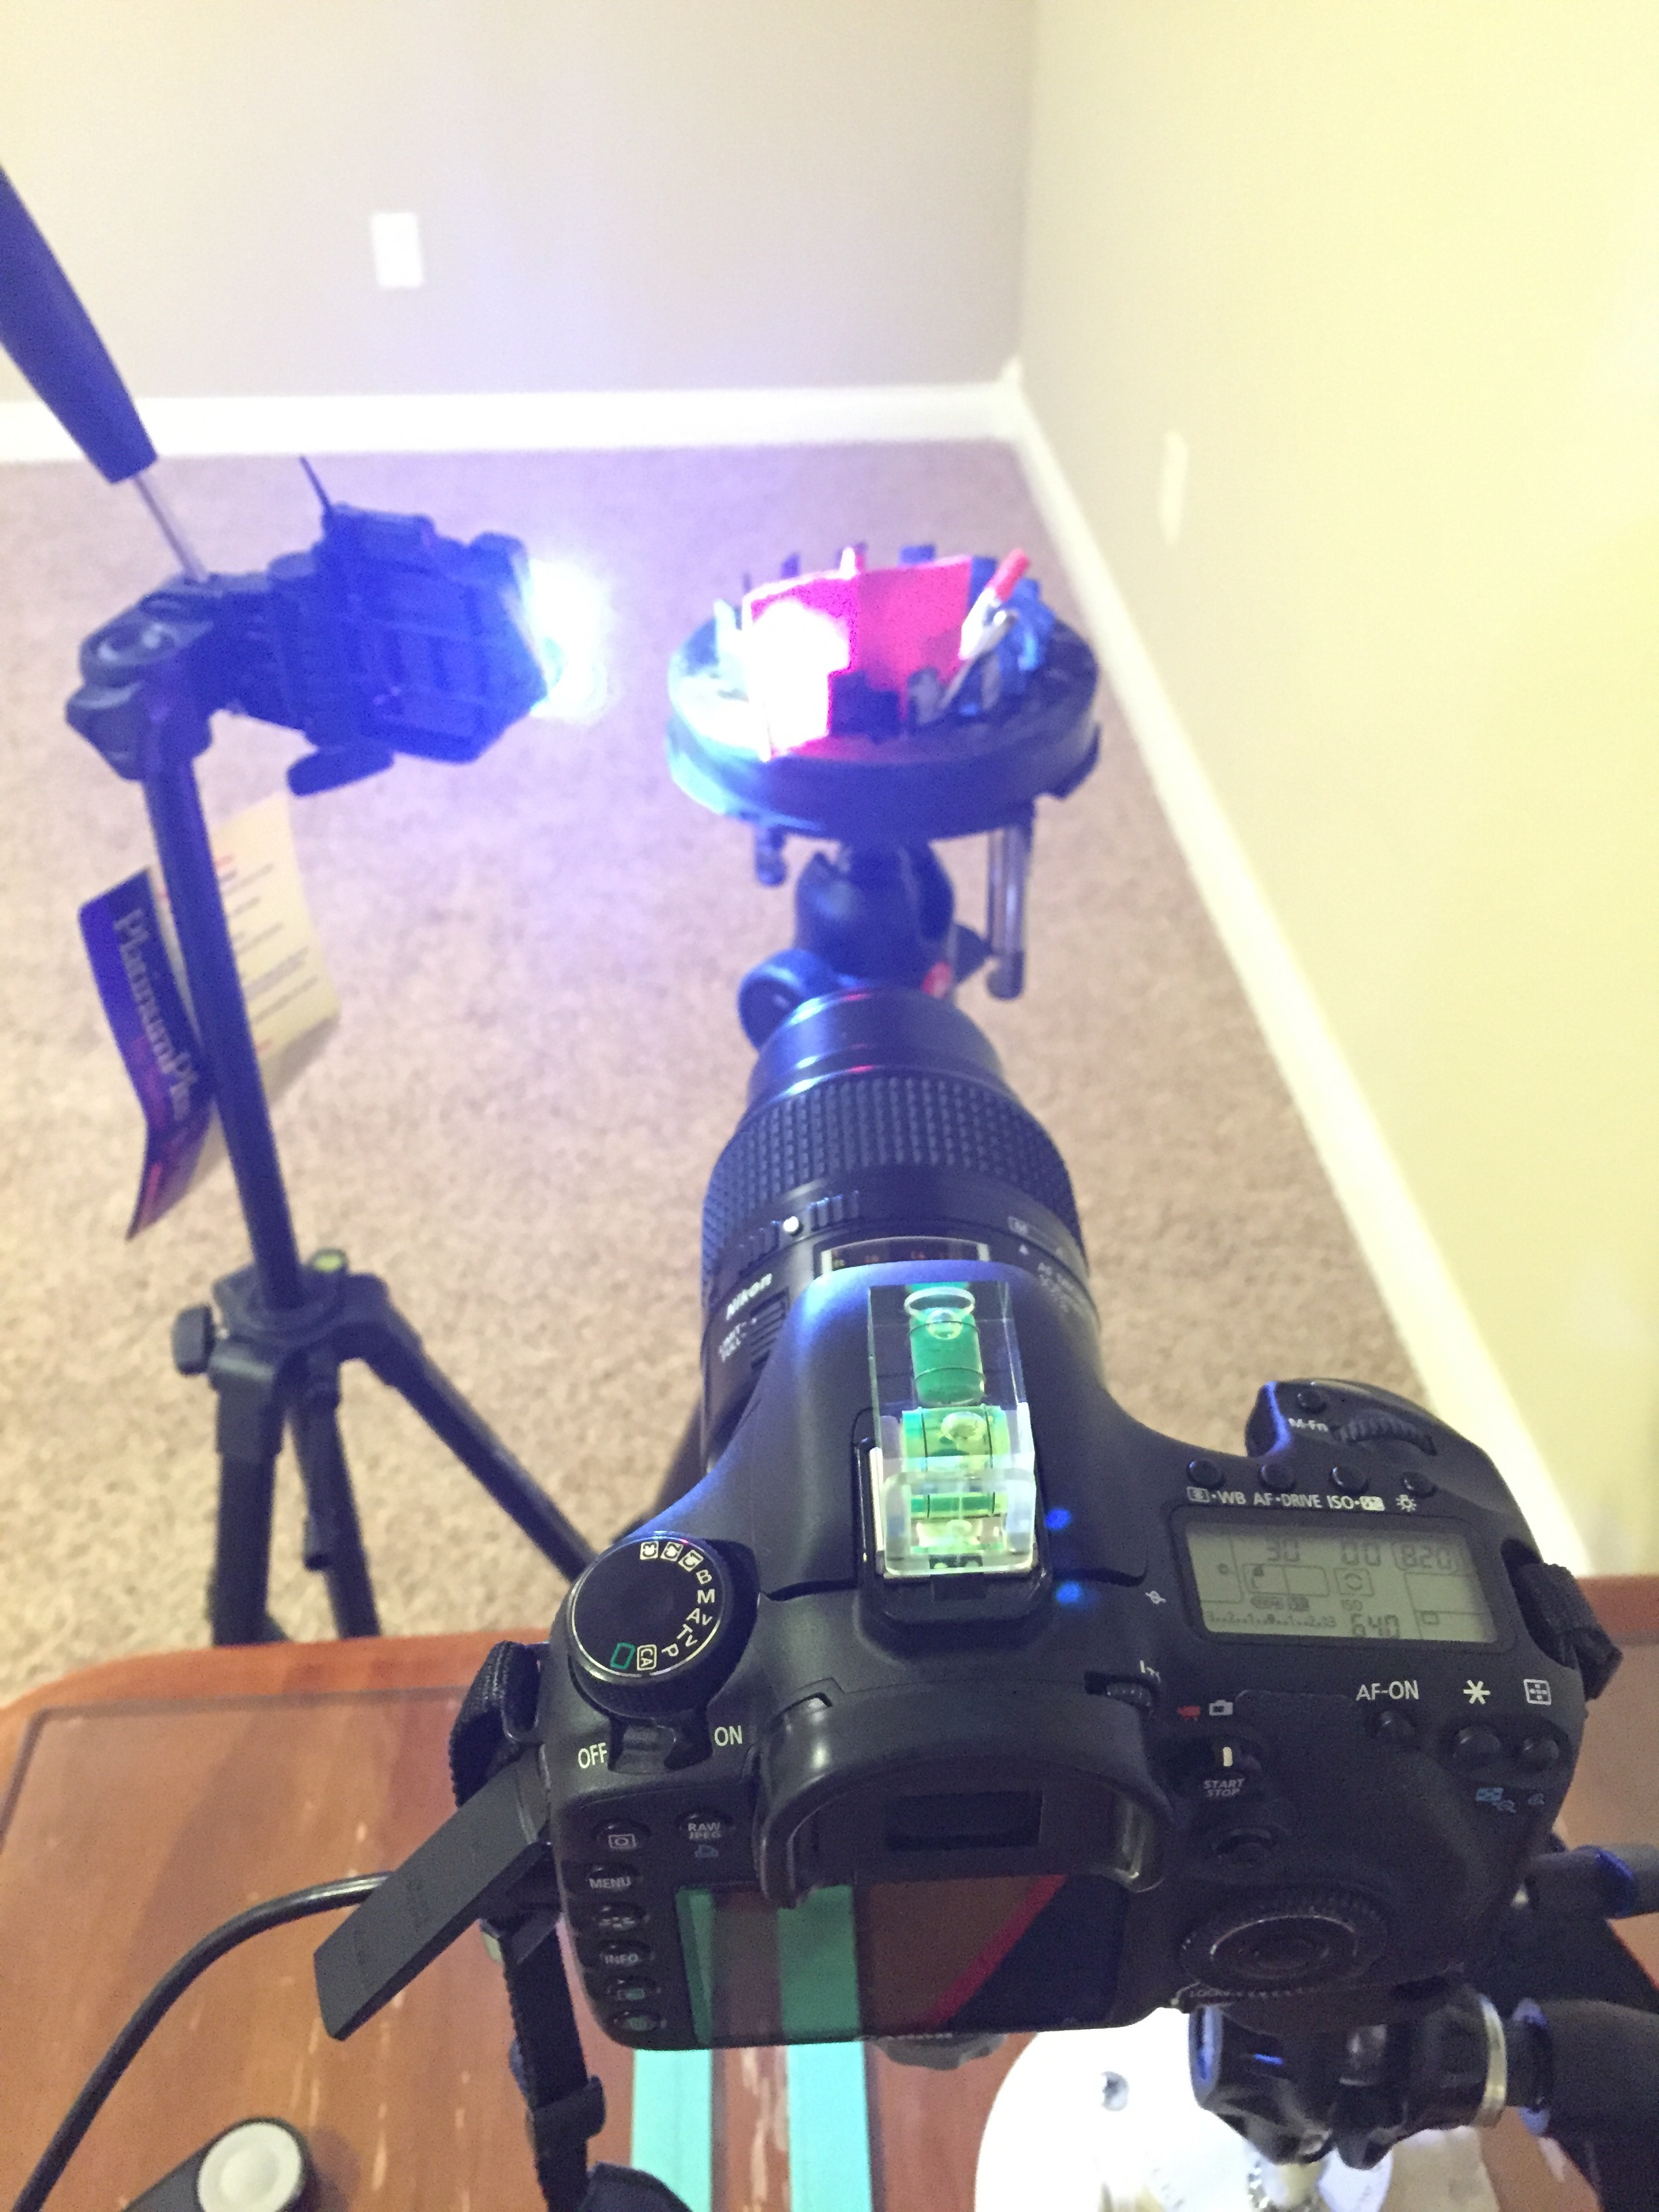
Illumination Strategy
Two lighting techniques were evaluated:
- Incident Illumination: Natural window light for surface detail capture
- Backlight Silhouette: Red-filtered backlight creating high-contrast edge detection
The backlight technique proved superior for automated processing, generating clear silhouettes where non-vane regions appear red, facilitating precise edge detection through color channel separation.
Image Processing Pipeline
Sample Analysis Workflow
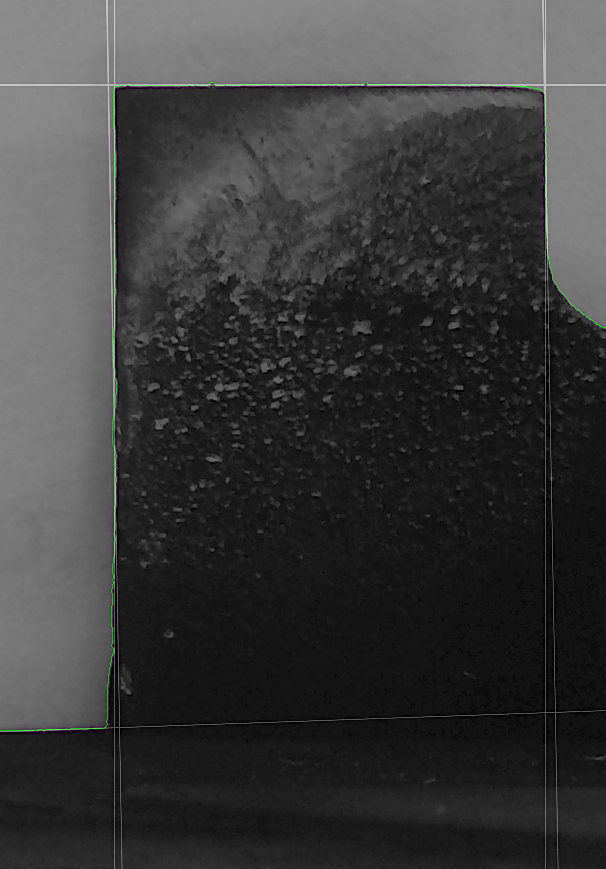

# Enhance contrast for improved edge detection
convert red.jpg -contrast -contrast -contrast red.jpg
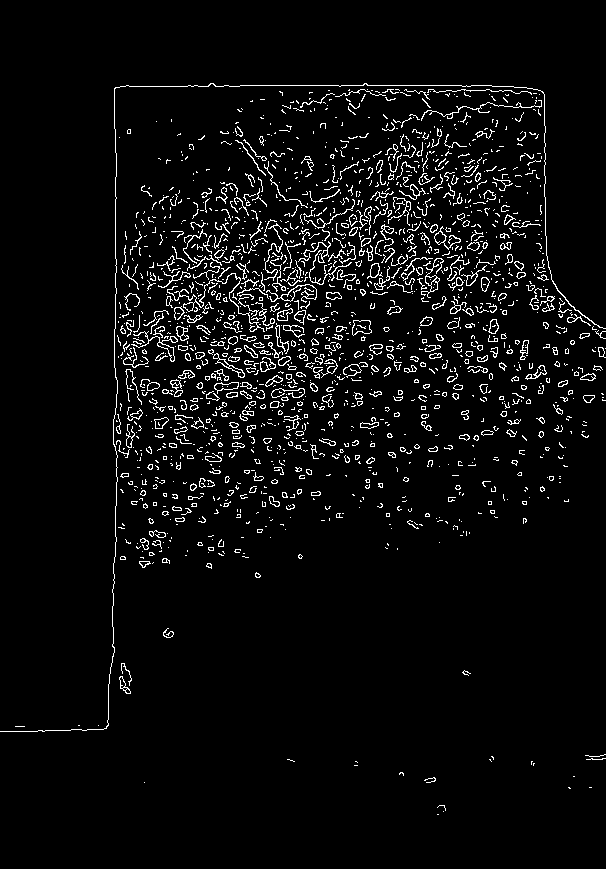
# Apply Canny edge detection algorithm
convert red.jpg -canny .001x1+16%+25% canny.jpg
# Fill and isolate edge regions
convert canny.jpg -bordercolor white -fill red -draw "color 120,1000 filltoborder" cred.png
# Generate binary edge image
convert canny.jpg -fill red -draw "color 0,0 floodfill" -alpha off -fill black +opaque red -fill white -opaque red binary.png
# Extract final edge profile
convert binary.png -background none -fill red -morphology edgein octagon:1 edge.png
convert edge.png -flip edge.png
# Export coordinate data for statistical analysis
convert canny.jpg txt:- | grep "white\|gray(255)" | sed -n 's/^\([0-9]*,[0-9]*\).*$/\1/p' > coordinates.txt
# Generate Hough line detection overlay
convert canny.jpg -background none -fill red -stroke red -strokewidth 1 -hough-lines 20x20+210 hough.jpg
convert canny.jpg hough.jpg -composite composite.jpgResults and Analysis
Quantitative Measurements
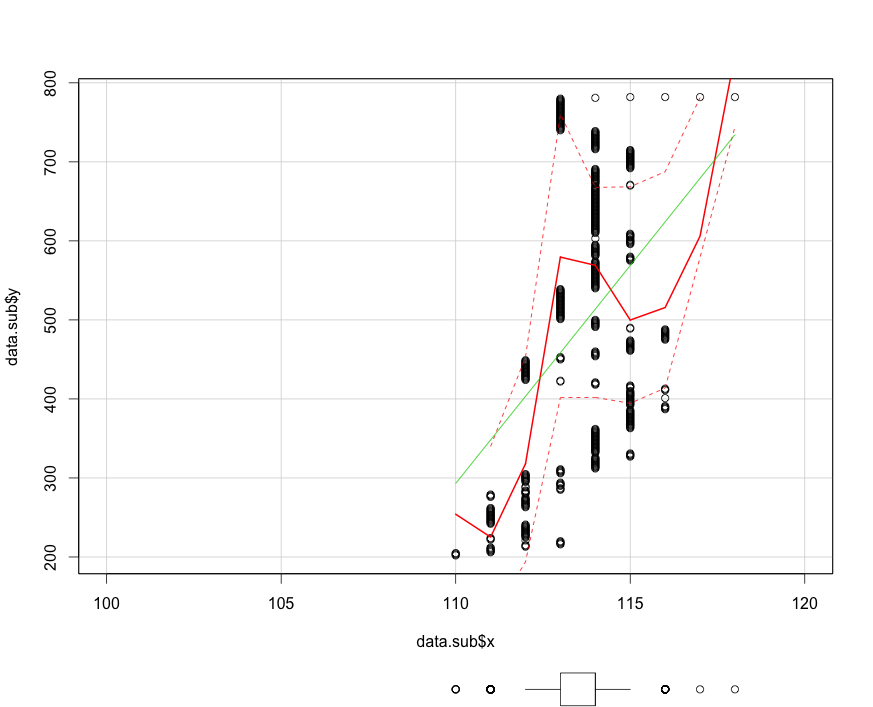
Measurement Parameters: - Y-Axis: Distance from vane base to leading edge (mm) - X-Axis: Deviation from nominal straight-line edge profile (μm)
The analysis reveals quantifiable deviations from the ideal vane geometry, enabling statistical characterization of wear patterns and severity assessment.
Implementation and Source Code
Complete implementation available on GitHub: rsangole/vanewear
Conclusions
This methodology demonstrates the feasibility of using open-source tools for precision measurement of mechanical component wear. The system provides:
- Automated, repeatable measurements
- Statistical quantification of wear patterns
- Cost-effective alternative to traditional metrology
- Scalable approach for production quality control
Future development could include machine learning classification of wear patterns and integration with predictive maintenance systems.