Tétouan Electric Consumption, EDA & Predictive Modeling

Visualization
EDA
An exploration of electric consumption, and some quick predictive modeling
Author

Rahul

Published

August 4, 2022

Introduction

Welcome to the EDA and time-series modeling of the the Tétouan Electrical Consumption data, uploaded by fedesoriano.

This is Part 1 of a two part series exploring this data set.

In this notebook, you’ll see,

  • Traditional time-series exploratory visuals, to get an understanding of the dataset
  • Time Series Linear Modeling to create a predictive linear model for power consumption

In Part 2, you’ll see multivariate approaches towards understanding the time-series, as well as extraction of time series patterns.

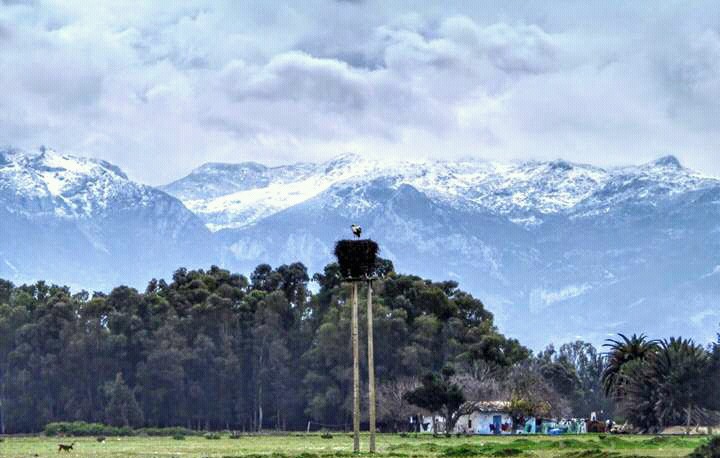
Tétouan is a city in northern Morocco with a population of ~0.5 million. Look at these gorgeous photos from Wikipedia.

Initial Setup

Libraries

Code
# Data Manipulation
library(dplyr)
library(tidyr)
library(readr)
library(skimr)
library(purrr)
library(stringr)
library(urltools)
library(magrittr)
library(lubridate)
library(janitor)

# Plots
library(ggplot2)
library(naniar)
library(packcircles)
library(ggridges)
library(ggbeeswarm)
library(patchwork)

# Time Series
library(timetk)

# Modeling
library(see)
library(parameters)
library(performance)

# Tables
library(reactable)

# Settings
theme_set(theme_minimal(
  base_size = 13,
  base_family = "Menlo"))
theme_update(
  plot.title.position = "plot"
)

Read In

Let’s start be reading in the data. There is only one CSV file. {janitor::clean_names} helps us get clean column names quickly. Here’s a peek into the dataset.

Code
dat <- read_csv("input/electric-power-consumption/powerconsumption.csv") %>% 
  clean_names()
glimpse(dat, 100)
Rows: 52,416
Columns: 9
$ datetime                <chr> "1/1/2017 0:00", "1/1/2017 0:10", "1/1/2017 0:20", "1/1/2017 0:30"…
$ temperature             <dbl> 6.559, 6.414, 6.313, 6.121, 5.921, 5.853, 5.641, 5.496, 5.678, 5.4…
$ humidity                <dbl> 73.8, 74.5, 74.5, 75.0, 75.7, 76.9, 77.7, 78.2, 78.1, 77.3, 77.5, …
$ wind_speed              <dbl> 0.083, 0.083, 0.080, 0.083, 0.081, 0.081, 0.080, 0.085, 0.081, 0.0…
$ general_diffuse_flows   <dbl> 0.051, 0.070, 0.062, 0.091, 0.048, 0.059, 0.048, 0.055, 0.066, 0.0…
$ diffuse_flows           <dbl> 0.119, 0.085, 0.100, 0.096, 0.085, 0.108, 0.096, 0.093, 0.141, 0.1…
$ power_consumption_zone1 <dbl> 34055.70, 29814.68, 29128.10, 28228.86, 27335.70, 26624.81, 25998.…
$ power_consumption_zone2 <dbl> 16128.88, 19375.08, 19006.69, 18361.09, 17872.34, 17416.41, 16993.…
$ power_consumption_zone3 <dbl> 20240.96, 20131.08, 19668.43, 18899.28, 18442.41, 18130.12, 17945.…

Quick View

{skimr} gives a detailed dive into the dataset. Few takeaways:

  • datetime is imported as character, and needs to be handled
  • no missing data at all (thank you, fedesoriano)
  • zone 1, 2 and 3 are in the order of their mean and p90 power consumption ranges
  • wind speed is oddly bimodal. It’s only no-wind or windy in Tetouan? Seems fishy.
  • finally, I’ll be honest - I have no idea what general diffuse flows or diffuse flows mean, despite the definition in the data page
Code
skim(dat)
Data summary
Name dat
Number of rows 52416
Number of columns 9
_______________________
Column type frequency:
character 1
numeric 8
________________________
Group variables None

Variable type: character

skim_variable n_missing complete_rate min max empty n_unique whitespace
datetime 0 1 13 16 0 52416 0

Variable type: numeric

skim_variable n_missing complete_rate mean sd p0 p25 p50 p75 p100 hist
temperature 0 1 18.81 5.82 3.25 14.41 18.78 22.89 40.01 ▂▇▇▂▁
humidity 0 1 68.26 15.55 11.34 58.31 69.86 81.40 94.80 ▁▂▅▇▇
wind_speed 0 1 1.96 2.35 0.05 0.08 0.09 4.92 6.48 ▇▁▁▅▁
general_diffuse_flows 0 1 182.70 264.40 0.00 0.06 5.04 319.60 1163.00 ▇▂▁▁▁
diffuse_flows 0 1 75.03 124.21 0.01 0.12 4.46 101.00 936.00 ▇▁▁▁▁
power_consumption_zone1 0 1 32344.97 7130.56 13895.70 26310.67 32265.92 37309.02 52204.40 ▁▇▇▅▁
power_consumption_zone2 0 1 21042.51 5201.47 8560.08 16980.77 20823.17 24713.72 37408.86 ▂▇▇▃▁
power_consumption_zone3 0 1 17835.41 6622.17 5935.17 13129.33 16415.12 21624.10 47598.33 ▆▇▃▁▁

Interesting Questions

Since this is an open ended exploration, I will posit some questions which will guide the flow of further work.

  1. How does the power consumption vary by each zone?
  2. Are there temporal patterns in the power consumption?
  3. Can a linear predictive model be built using simple features?
  4. What’s the relationship with temperature, humidity, etc?
  5. What does a multivariate study of the data set show? … in part 2
  6. Are there customer usage patterns found in the time series? … in part 2

Feature Development

To aid answering many of these, I first need to create a few new features in the data set.

We go from 9 columns to 24 columns in the data set.

Date-Time Features

Date-time features are excellent ways to add more depth to the time dimension of the dataset. The timetk::tk_augment_timeseries_signature is one of the best tools to do so. The function creates a bunch of columns I don’t want for this analysis, so I exclude them. Finally, I’m renaming the power for brevity’s sake.

Code
dat <- dat %>% 
  mutate(datetime = as_datetime(datetime, format = "%m/%d/%Y %H:%M"),
         dt_hr = round_date(datetime, "hour")) %>%
  tk_augment_timeseries_signature(datetime) %>%
  select(
    - matches("(xts)|(second)|(minute)|(iso)|(num)|(diff$)|(hour12)|(am.pm)|(week\\d)|(mday7)")
  ) %>% 
  mutate(hour = factor(hour, ordered = TRUE)) %>% 
  rename_with(~str_replace(.x, "power_consumption_", ""), contains("zone"))

dat %>% glimpse(80)
Rows: 52,416
Columns: 24
$ datetime              <dttm> 2017-01-01 00:00:00, 2017-01-01 00:10:00, 2017-…
$ temperature           <dbl> 6.559, 6.414, 6.313, 6.121, 5.921, 5.853, 5.641,…
$ humidity              <dbl> 73.8, 74.5, 74.5, 75.0, 75.7, 76.9, 77.7, 78.2, …
$ wind_speed            <dbl> 0.083, 0.083, 0.080, 0.083, 0.081, 0.081, 0.080,…
$ general_diffuse_flows <dbl> 0.051, 0.070, 0.062, 0.091, 0.048, 0.059, 0.048,…
$ diffuse_flows         <dbl> 0.119, 0.085, 0.100, 0.096, 0.085, 0.108, 0.096,…
$ zone1                 <dbl> 34055.70, 29814.68, 29128.10, 28228.86, 27335.70…
$ zone2                 <dbl> 16128.88, 19375.08, 19006.69, 18361.09, 17872.34…
$ zone3                 <dbl> 20240.96, 20131.08, 19668.43, 18899.28, 18442.41…
$ dt_hr                 <dttm> 2017-01-01 00:00:00, 2017-01-01 00:00:00, 2017-…
$ year                  <int> 2017, 2017, 2017, 2017, 2017, 2017, 2017, 2017, …
$ half                  <int> 1, 1, 1, 1, 1, 1, 1, 1, 1, 1, 1, 1, 1, 1, 1, 1, …
$ quarter               <int> 1, 1, 1, 1, 1, 1, 1, 1, 1, 1, 1, 1, 1, 1, 1, 1, …
$ month                 <int> 1, 1, 1, 1, 1, 1, 1, 1, 1, 1, 1, 1, 1, 1, 1, 1, …
$ month.lbl             <ord> January, January, January, January, January, Jan…
$ day                   <int> 1, 1, 1, 1, 1, 1, 1, 1, 1, 1, 1, 1, 1, 1, 1, 1, …
$ hour                  <ord> 0, 0, 0, 0, 0, 0, 1, 1, 1, 1, 1, 1, 2, 2, 2, 2, …
$ wday                  <int> 1, 1, 1, 1, 1, 1, 1, 1, 1, 1, 1, 1, 1, 1, 1, 1, …
$ wday.lbl              <ord> Sunday, Sunday, Sunday, Sunday, Sunday, Sunday, …
$ mday                  <int> 1, 1, 1, 1, 1, 1, 1, 1, 1, 1, 1, 1, 1, 1, 1, 1, …
$ qday                  <int> 1, 1, 1, 1, 1, 1, 1, 1, 1, 1, 1, 1, 1, 1, 1, 1, …
$ yday                  <int> 1, 1, 1, 1, 1, 1, 1, 1, 1, 1, 1, 1, 1, 1, 1, 1, …
$ mweek                 <int> 5, 5, 5, 5, 5, 5, 5, 5, 5, 5, 5, 5, 5, 5, 5, 5, …
$ week                  <int> 1, 1, 1, 1, 1, 1, 1, 1, 1, 1, 1, 1, 1, 1, 1, 1, …

Graphical EDA

Given we have time series data, I’ll start with a simple plot of each of the series to visually inspect the data. Graphically inspecting the series will often reveal so much information lost to aggregated statistics. Look at the plot below. Right away we can take away quite a bit of new learning:

  1. Lots of rich dynamics (at least visually) in the power series which we can try to extract later.
  2. Temperature and humidity don’t seem to have (at least visually) any strong correlation to the power values.
  3. Wind speed is interesting - while there are no missing values, I believe we have a case of a malfunctioning wind speed sensor. Notice the bi modal behavior of wind speed. It’s either ~0, or spikes up directly to ~5, with no intermediate values. I’m going to drop this feature downstream.
  4. General diffuse flows and diffuse flows are roughly 100% in agreement with each other. I wonder what contribution they have in explaining the power readings?
Code
dat %>% 
  select(datetime, contains("zone")) %>% 
  pivot_longer(-datetime) %>% 
  ggplot(aes(datetime, value)) +
  geom_vline(xintercept = as.POSIXct("2017-06-26"), color = "black", lty = 2) +
  geom_line(aes(color = name)) +
  scale_y_continuous(labels = scales::label_number_si()) +
  labs(
    x = NULL,
    y = "Power",
    color = "Zone"
  ) -> p1

dat %>% 
  ggplot(aes(datetime, temperature)) +
  geom_line() +
  labs(
    x = NULL,
    y = "Temperature"
  ) -> p2

dat %>% 
  ggplot(aes(datetime, humidity)) +
  geom_line() +
  labs(
    x = NULL,
    y = "Humidity"
  ) -> p3

dat %>% 
  ggplot(aes(datetime, wind_speed)) +
  geom_line() +
  labs(
    x = NULL,
    y = "Wind Speed"
  ) -> p4

dat %>% 
  select(datetime, contains("flows")) %>% 
  pivot_longer(-datetime) %>% 
  ggplot(aes(datetime, value)) +
  geom_line(aes(color = name)) +
  labs(
    x = NULL,
    y = "Flows",
    color = "Flows"
  ) -> p5
p1 / p2 / p3 / p4 / p5 +
  patchwork::plot_annotation(
    title = "Tétouan Electric Power Readings - Year of 2017"
  )

Some further notes:

  • I see a strong change in the behavior of the series at roughly 27th July 2017. I’ve marked this with the black dotted line in the plot above.
  • Visually, I can see the power values suddenly drop a bit, with no visual cues from either of the other graphs, like temperature or humidity.
  • If we zoom into this region (+/- 10 days) in the plots below, we can clearly see the drop for zone 1.
  • The box plots confirm this with a drop in the median value between the two regions. I can leverage this later for some modeling.
Code
dat %>% 
  filter(datetime > "2017-06-16", datetime < "2017-07-06") %>% 
  select(datetime, contains("zone")) %>% 
  pivot_longer(-datetime) %>% 
  ggplot(aes(datetime, value)) +
  geom_vline(xintercept = as.POSIXct("2017-06-26"), color = "black", lty = 2) +
  geom_line(aes(color = name)) +
  scale_y_continuous(labels = scales::label_number_si()) +
  labs(
    x = NULL,
    y = "Power",
    color = "Zone"
  )-> p1

split_date <- as.Date("2017-06-27")
n_days <- 7
dat %>%
  filter(datetime > split_date - n_days, datetime < split_date + n_days) %>%
  mutate(split = ifelse(
    datetime > split_date,
    sprintf("After %s", format(split_date, "%b-%Y")),
    sprintf("Before %s", format(split_date, "%b-%Y"))),
    split = factor(split, 
                   ordered = TRUE,
                    levels = c(sprintf("Before %s", format(split_date, "%b-%Y")),
                               sprintf("After %s", format(split_date, "%b-%Y"))
                               ))) %>%
  select(split, contains("zone")) %>%
  pivot_longer(-split) %>%
  ggplot(aes(x = split, y = value, color = split)) +
  geom_boxplot() +
  geom_jitter(width = 0.2, alpha = 0.2) +
  scale_y_continuous(labels = scales::label_number_si()) +
  facet_wrap(~name, nrow = 1, strip.position = 'bottom') +
  theme(legend.position = "none") +
  labs(
    x = NULL,
    y = "Power",
    color = NULL
  ) -> p2

p1 / p2 +
  plot_annotation(
     title = "Power, zoomed in to 15 Dec-31 Dec 2017"
  )

Seasonalities

Aggregating the 10-minutely time-series to it’s larger temporal groupings is another way to gather some insights. Here, I’m plotting box-plots for hourly, daily, and monthly aggregations. What do we see?

  • At the Hourly level, consumption is the lowest at the wee hours of the morning, steadily increasing through the day, with significant upshoots post 6PM. Zone 1 is clearly dominant, with not only the largest absolute values, but the largest changes from min to max values as well.
  • It’s hard to see any significant difference at the daily level
  • At the Monthly level, July-August is certainly the worst, probably due to it being summer and the air conditioning loads on the system.
Code
dat %>% 
  select(wday.lbl, contains("zone")) %>% 
  pivot_longer(-wday.lbl) %>% 
  ggplot(aes(wday.lbl, value)) +
  geom_boxplot(aes(color = name),
               outlier.alpha = 0.1) +
  scale_y_continuous(labels = scales::label_number_si()) +
  labs(x = "Day",
       y = "Power", 
       color = "Zone") -> p_wday

dat %>% 
  select(hour, contains("zone")) %>% 
  pivot_longer(-hour) %>% 
  ggplot(aes(hour, value)) +
  geom_boxplot(aes(color = name),
               outlier.alpha = 0.1) +
  scale_y_continuous(labels = scales::label_number_si()) +
  theme(legend.position = "none") +
  labs(x = "Hour",
       y = "Power")  -> p_hour

dat %>% 
  select(month.lbl, contains("zone")) %>% 
  pivot_longer(-month.lbl) %>% 
  ggplot(aes(month.lbl, value)) +
  geom_boxplot(aes(color = name),
               outlier.alpha = 0.1) +
  scale_y_continuous(labels = scales::label_number_si()) +
  theme(legend.position = "none") +
  labs(x = "Month",
       y = "Power")  -> p_month

p_hour / p_wday / p_month

Yet another fun way to visualize the series is using Matt Dancho’s amazing {timetk} package and it’s handy plot_time_series_boxplot() function. Here’s a plot for weekly aggregations for the same data.

Code
dat %>% 
  select(datetime, month.lbl, contains("zone")) %>% 
  pivot_longer(-datetime:-month.lbl) %>% 
  group_by(name) %>% 
  timetk::plot_time_series_boxplot(datetime, value, "1 week")

Time Series Linear Modeling (TSLM)

Here, I’m investigating if it’s possible to fit a simple time series linear model (TSLM) to the data, specifically three linear models, one for each zone.

Quick Modeling

I won’t delve into all the various models I tried out, but suffice to say, TSLM works just beautifully on this dataset - like an academic example. I found that humidity and some of the other variables didn’t add a lot of value. The variables I narrowed down to are month.lbl, temperature, day, hour, week and lag-1_values.

Again, I use a fantastic function from the {timetk} package called plot_time_series_regression() which can very quickly create grouped TSLM models for quick prototyping.

Just look at how well a TSLM model works here. When plotted for the whole year, we can’t even distinguish the original signal (value in black), from the prediction (fitted in red)!

Code
dat %>% 
  select(datetime,
         month.lbl,
         temperature,
         day,
         hour,
         week,
         contains("zone")) %>% 
  pivot_longer(-datetime:-week, names_to = "zone") %>% 
  group_by(zone) %>%
  plot_time_series_regression(
    .date_var = datetime,
    value ~ month.lbl+  temperature + as.factor(day) + hour + week + lag(value) ,
    .show_summary = FALSE,
    .interactive = FALSE
  ) -> p
p +
  labs(title = "Power vs Prediction, Year of 2017")

If I zoom in a bit, you can notice where the signals disagree, but even then, ever so minutely. What a wonderful fit.

Code
p +
  scale_x_datetime(limits = c(as.POSIXct("2017-01-01 00:00:00"),
                              as.POSIXct("2017-01-07 00:00:00"))) +
  labs(title = "Power vs Prediction, 1st week of Jan 2017")

Insights

Let’s poke a bit more into the TSLM model.

Code
dat <- dat %>% 
  mutate(
    month.lbl = as.character(month.lbl),
    day = as.factor(day),
    hour = as.character(hour)
  )
mod_base <- lm(
  formula = zone1 ~ month.lbl + temperature + day + hour + week + lag(zone1),
  data = dat
)
report::report_model(mod_base)
linear model (estimated using OLS) to predict zone1 with month.lbl, temperature, day, hour, week and zone1 (formula: zone1 ~ month.lbl + temperature + day + hour + week + lag(zone1))

Here’s the overall model performance. As expected, very high values for adjusted-Rsq, and a low value of RMSE (<1.5% of mean Zone1).

Code
model_performance(mod_base)
# Indices of model performance

AIC       |      AICc |       BIC |    R2 | R2 (adj.) |    RMSE |   Sigma
-------------------------------------------------------------------------
7.991e+05 | 7.991e+05 | 7.997e+05 | 0.995 |     0.995 | 493.825 | 494.146

Let’s dig deeper into the coefficients for the linear model. We can look at this in two ways.

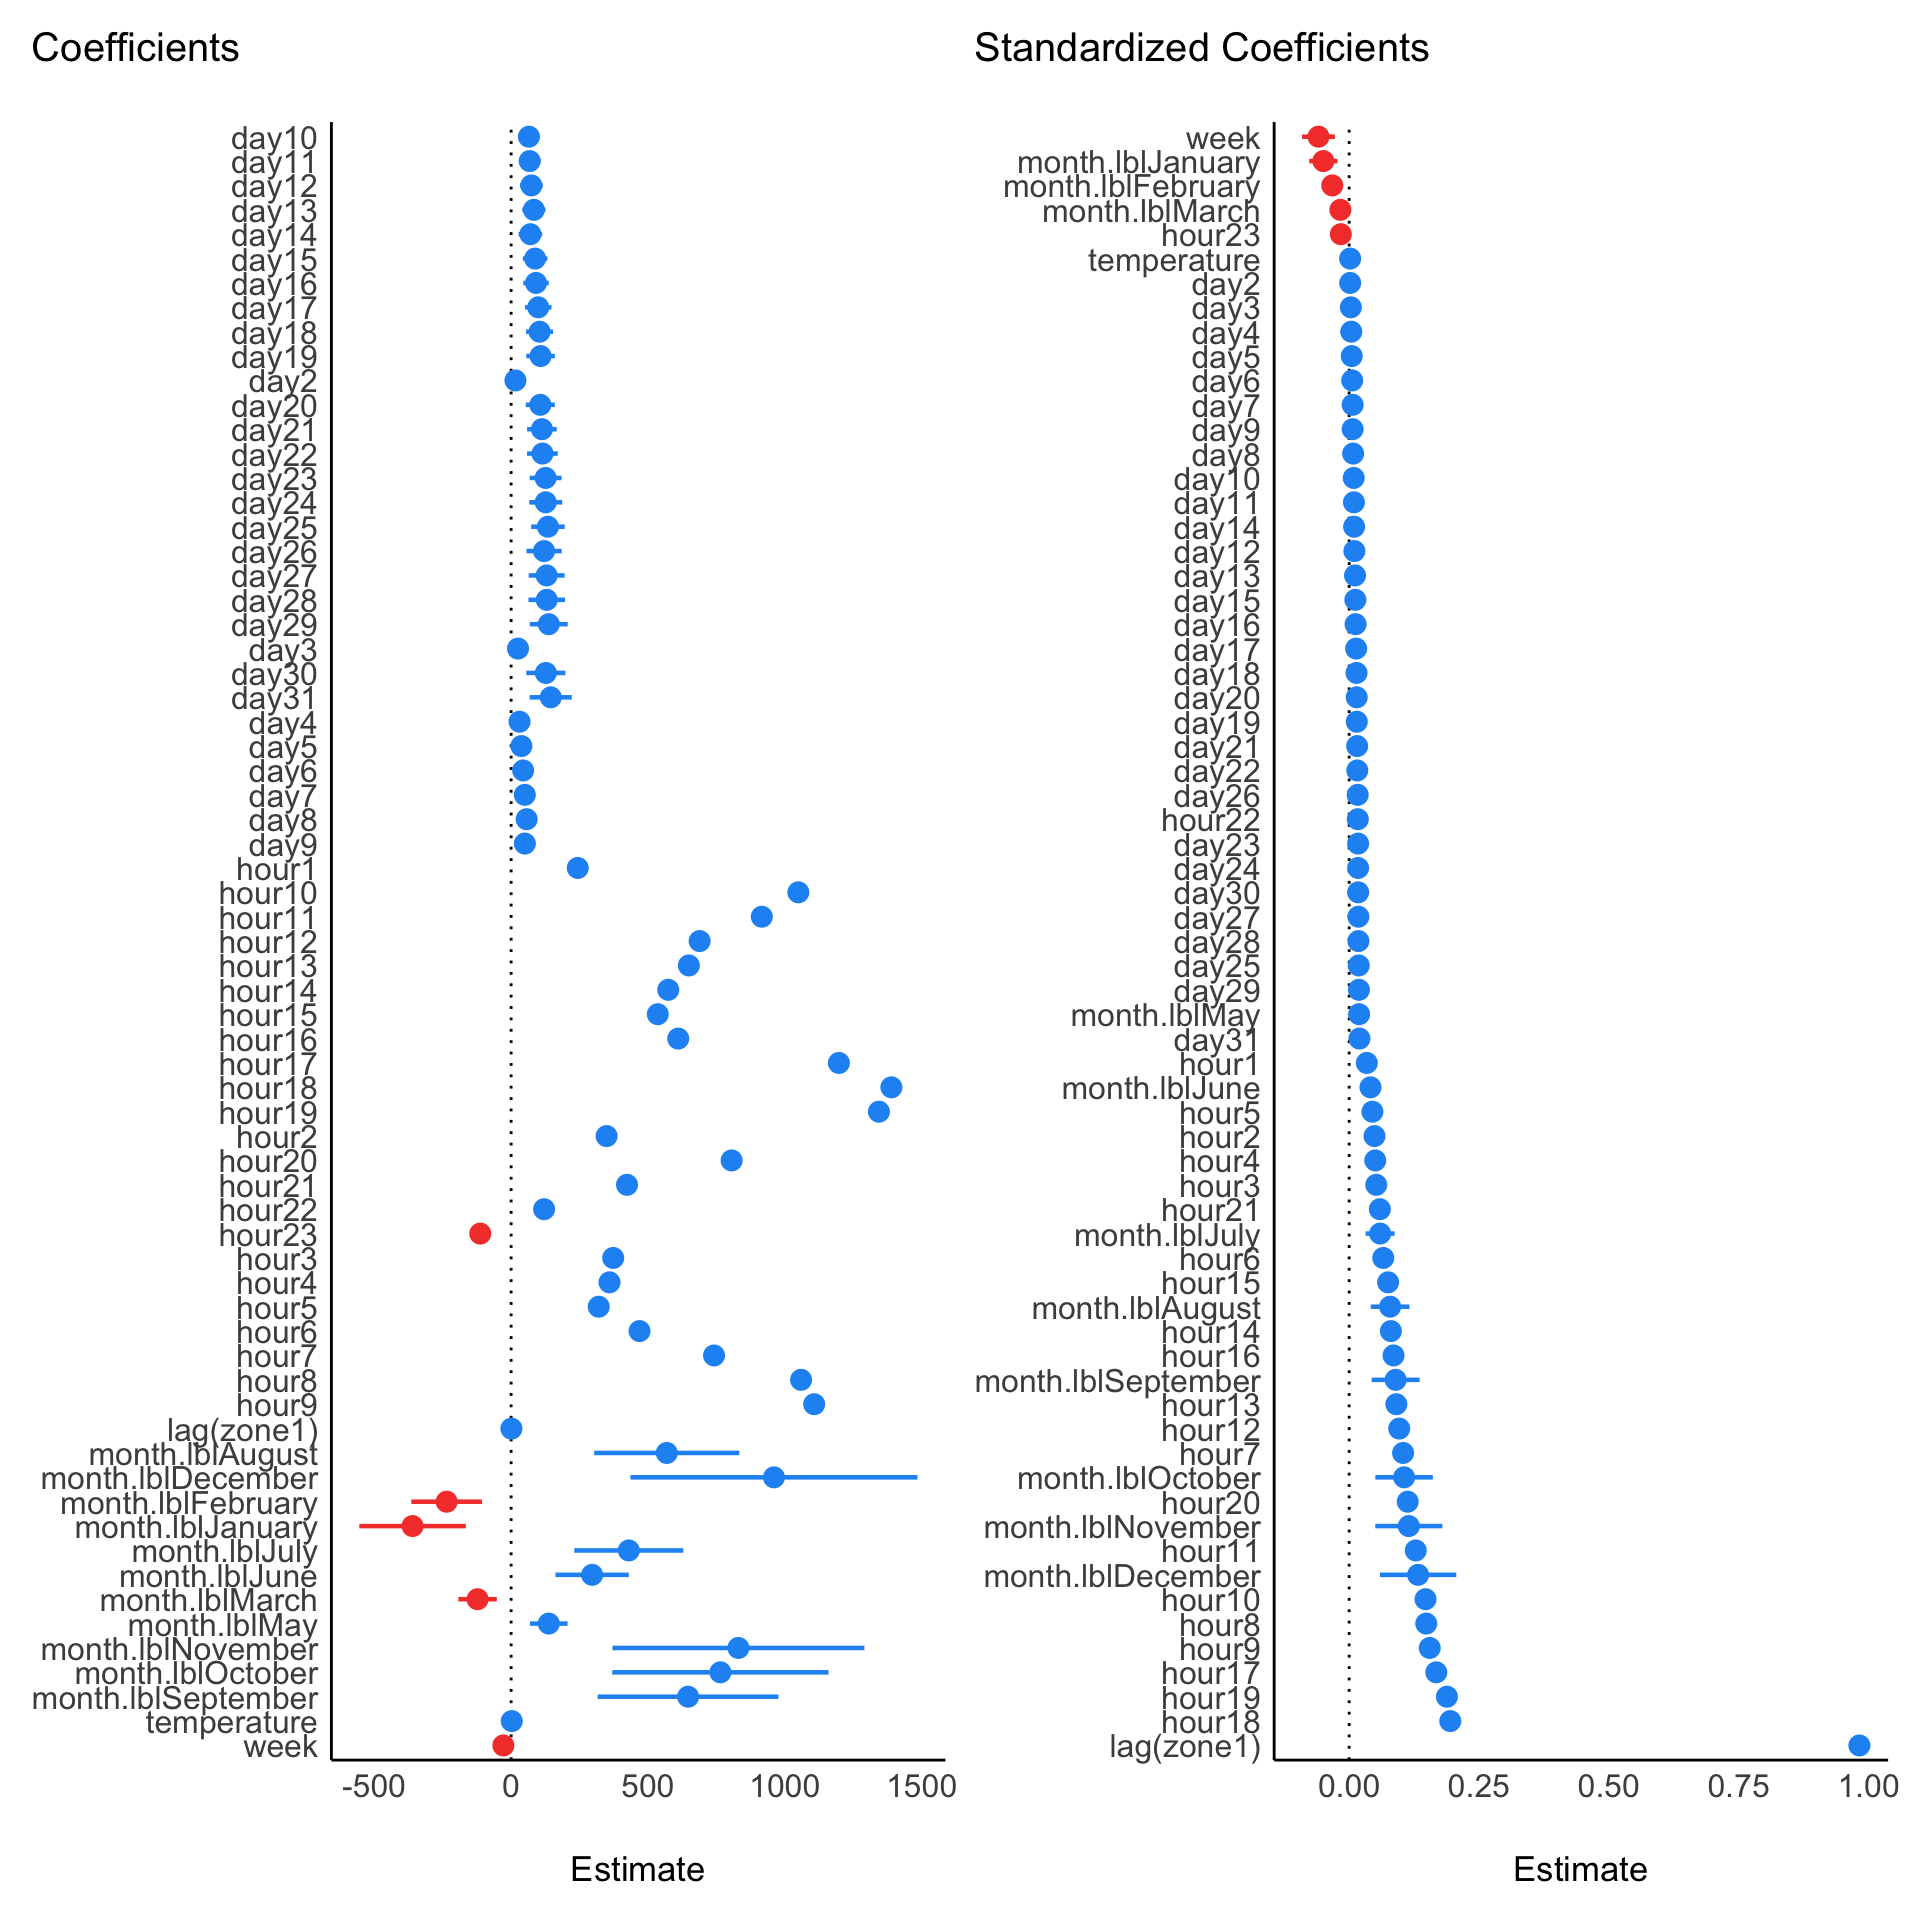
On the left, are the actual coefficients for each parameter. The y axis is sorted alphabetically. The points show the point estimats for the beta coefficients with the horizontal lines showing the error bars. Negative coefficients are in red. While we can see varying ranges for the beta coeffs, we cannot compare these against each other, since the data are not scaled. That’s why I won’t sort the Y axis on the estimates.

If we do scale the data and calculate the coefficients (done here using the standardize = 'refit' option in parameters()), then all the features are on the same scale, and the coefficients can be sorted to show the relative impact of each feature on the final predicted value. The plot on the right are these ‘standardized coefficients’. Now, it’s obvious to see that lag(zone1) has the highest impact on the predicted value of zone1 (makes sense intuitvely), followed by coeffs for the hours, months, and so on. week number has a negative and lower impact, while temperature has almost no impact on the predictions. Scaling data and plotting the beta coefficients gives us our variable importance plot.

Code
parameters::parameters(mod_base) %>% 
  mutate(Parameter = ifelse(Parameter == "zone 1", "lag_zone_1", Parameter)) %>%
  arrange(Parameter) %>% 
  plot() +
  labs(title = "Coefficients")-> p1

parameters::parameters(mod_base, standardize = 'refit') %>%
  arrange(Coefficient) %>%
  mutate(Parameter = ifelse(Parameter == "zone 1", "lag_zone_1", Parameter)) %>%
  plot() +
  labs(title = "Standardized Coefficients") -> p2

p1 | p2

I can just as quickly test that lag(zone1) has a big impact on the model performance. Here, I’ll create a model without the lagged values, and we can see the model performance drop significantly. RMSE is now ~8.5% of mean Zone1 values, and Adj-R2 is down to 85%.

Code
mod_nolag <- lm(
  formula = zone1 ~ month.lbl + temperature + day + hour + week,
  data = dat[-1, ]
)
report::report_model(mod_nolag)
linear model (estimated using OLS) to predict zone1 with month.lbl, temperature, day, hour and week (formula: zone1 ~ month.lbl + temperature + day + hour + week)
Code
model_performance(mod_nolag)
# Indices of model performance

AIC       |      AICc |       BIC |    R2 | R2 (adj.) |     RMSE |    Sigma
---------------------------------------------------------------------------
9.775e+05 | 9.775e+05 | 9.781e+05 | 0.856 |     0.855 | 2710.002 | 2711.736
Code
parameters::parameters(mod_nolag, standardize = 'refit') %>%
  arrange(Coefficient) %>%
  mutate(Parameter = ifelse(Parameter == "zone 1", "lag_zone_1", Parameter)) %>%
  plot() +
  labs(title = "Standardized Coefficients - Model with No Lag") 

I haven’t plotted out the TSLMs for the other zones, but they behave just as well and are powerful predictive models.


Poking around such a well behaved and clean time series is always a joy!


Subscribe to my newsletter!